Game Theory Trading StrategyGame Theory Trading Strategy: Explanation and Working Logic
This Pine Script (version 5) code implements a trading strategy named "Game Theory Trading Strategy" in TradingView. Unlike the previous indicator, this is a full-fledged strategy with automated entry/exit rules, risk management, and backtesting capabilities. It uses Game Theory principles to analyze market behavior, focusing on herd behavior, institutional flows, liquidity traps, and Nash equilibrium to generate buy (long) and sell (short) signals. Below, I'll explain the strategy's purpose, working logic, key components, and usage tips in detail.
1. General Description
Purpose: The strategy identifies high-probability trading opportunities by combining Game Theory concepts (herd behavior, contrarian signals, Nash equilibrium) with technical analysis (RSI, volume, momentum). It aims to exploit market inefficiencies caused by retail herd behavior, institutional flows, and liquidity traps. The strategy is designed for automated trading with defined risk management (stop-loss/take-profit) and position sizing based on market conditions.
Key Features:
Herd Behavior Detection: Identifies retail panic buying/selling using RSI and volume spikes.
Liquidity Traps: Detects stop-loss hunting zones where price breaks recent highs/lows but reverses.
Institutional Flow Analysis: Tracks high-volume institutional activity via Accumulation/Distribution and volume spikes.
Nash Equilibrium: Uses statistical price bands to assess whether the market is in equilibrium or deviated (overbought/oversold).
Risk Management: Configurable stop-loss (SL) and take-profit (TP) percentages, dynamic position sizing based on Game Theory (minimax principle).
Visualization: Displays Nash bands, signals, background colors, and two tables (Game Theory status and backtest results).
Backtesting: Tracks performance metrics like win rate, profit factor, max drawdown, and Sharpe ratio.
Strategy Settings:
Initial capital: $10,000.
Pyramiding: Up to 3 positions.
Position size: 10% of equity (default_qty_value=10).
Configurable inputs for RSI, volume, liquidity, institutional flow, Nash equilibrium, and risk management.
Warning: This is a strategy, not just an indicator. It executes trades automatically in TradingView's Strategy Tester. Always backtest thoroughly and use proper risk management before live trading.
2. Working Logic (Step by Step)
The strategy processes each bar (candle) to generate signals, manage positions, and update performance metrics. Here's how it works:
a. Input Parameters
The inputs are grouped for clarity:
Herd Behavior (🐑):
RSI Period (14): For overbought/oversold detection.
Volume MA Period (20): To calculate average volume for spike detection.
Herd Threshold (2.0): Volume multiplier for detecting herd activity.
Liquidity Analysis (💧):
Liquidity Lookback (50): Bars to check for recent highs/lows.
Liquidity Sensitivity (1.5): Volume multiplier for trap detection.
Institutional Flow (🏦):
Institutional Volume Multiplier (2.5): For detecting large volume spikes.
Institutional MA Period (21): For Accumulation/Distribution smoothing.
Nash Equilibrium (⚖️):
Nash Period (100): For calculating price mean and standard deviation.
Nash Deviation (0.02): Multiplier for equilibrium bands.
Risk Management (🛡️):
Use Stop-Loss (true): Enables SL at 2% below/above entry price.
Use Take-Profit (true): Enables TP at 5% above/below entry price.
b. Herd Behavior Detection
RSI (14): Checks for extreme conditions:
Overbought: RSI > 70 (potential herd buying).
Oversold: RSI < 30 (potential herd selling).
Volume Spike: Volume > SMA(20) x 2.0 (herd_threshold).
Momentum: Price change over 10 bars (close - close ) compared to its SMA(20).
Herd Signals:
Herd Buying: RSI > 70 + volume spike + positive momentum = Retail buying frenzy (red background).
Herd Selling: RSI < 30 + volume spike + negative momentum = Retail selling panic (green background).
c. Liquidity Trap Detection
Recent Highs/Lows: Calculated over 50 bars (liquidity_lookback).
Psychological Levels: Nearest round numbers (e.g., $100, $110) as potential stop-loss zones.
Trap Conditions:
Up Trap: Price breaks recent high, closes below it, with a volume spike (volume > SMA x 1.5).
Down Trap: Price breaks recent low, closes above it, with a volume spike.
Visualization: Traps are marked with small red/green crosses above/below bars.
d. Institutional Flow Analysis
Volume Check: Volume > SMA(20) x 2.5 (inst_volume_mult) = Institutional activity.
Accumulation/Distribution (AD):
Formula: ((close - low) - (high - close)) / (high - low) * volume, cumulated over time.
Smoothed with SMA(21) (inst_ma_length).
Accumulation: AD > MA + high volume = Institutions buying.
Distribution: AD < MA + high volume = Institutions selling.
Smart Money Index: (close - open) / (high - low) * volume, smoothed with SMA(20). Positive = Smart money buying.
e. Nash Equilibrium
Calculation:
Price mean: SMA(100) (nash_period).
Standard deviation: stdev(100).
Upper Nash: Mean + StdDev x 0.02 (nash_deviation).
Lower Nash: Mean - StdDev x 0.02.
Conditions:
Near Equilibrium: Price between upper and lower Nash bands (stable market).
Above Nash: Price > upper band (overbought, sell potential).
Below Nash: Price < lower band (oversold, buy potential).
Visualization: Orange line (mean), red/green lines (upper/lower bands).
f. Game Theory Signals
The strategy generates three types of signals, combined into long/short triggers:
Contrarian Signals:
Buy: Herd selling + (accumulation or down trap) = Go against retail panic.
Sell: Herd buying + (distribution or up trap).
Momentum Signals:
Buy: Below Nash + positive smart money + no herd buying.
Sell: Above Nash + negative smart money + no herd selling.
Nash Reversion Signals:
Buy: Below Nash + rising close (close > close ) + volume > MA.
Sell: Above Nash + falling close + volume > MA.
Final Signals:
Long Signal: Contrarian buy OR momentum buy OR Nash reversion buy.
Short Signal: Contrarian sell OR momentum sell OR Nash reversion sell.
g. Position Management
Position Sizing (Minimax Principle):
Default: 1.0 (10% of equity).
In Nash equilibrium: Reduced to 0.5 (conservative).
During institutional volume: Increased to 1.5 (aggressive).
Entries:
Long: If long_signal is true and no existing long position (strategy.position_size <= 0).
Short: If short_signal is true and no existing short position (strategy.position_size >= 0).
Exits:
Stop-Loss: If use_sl=true, set at 2% below/above entry price.
Take-Profit: If use_tp=true, set at 5% above/below entry price.
Pyramiding: Up to 3 concurrent positions allowed.
h. Visualization
Nash Bands: Orange (mean), red (upper), green (lower).
Background Colors:
Herd buying: Red (90% transparency).
Herd selling: Green.
Institutional volume: Blue.
Signals:
Contrarian buy/sell: Green/red triangles below/above bars.
Liquidity traps: Red/green crosses above/below bars.
Tables:
Game Theory Table (Top-Right):
Herd Behavior: Buying frenzy, selling panic, or normal.
Institutional Flow: Accumulation, distribution, or neutral.
Nash Equilibrium: In equilibrium, above, or below.
Liquidity Status: Trap detected or safe.
Position Suggestion: Long (green), Short (red), or Wait (gray).
Backtest Table (Bottom-Right):
Total Trades: Number of closed trades.
Win Rate: Percentage of winning trades.
Net Profit/Loss: In USD, colored green/red.
Profit Factor: Gross profit / gross loss.
Max Drawdown: Peak-to-trough equity drop (%).
Win/Loss Trades: Number of winning/losing trades.
Risk/Reward Ratio: Simplified Sharpe ratio (returns / drawdown).
Avg Win/Loss Ratio: Average win per trade / average loss per trade.
Last Update: Current time.
i. Backtesting Metrics
Tracks:
Total trades, winning/losing trades.
Win rate (%).
Net profit ($).
Profit factor (gross profit / gross loss).
Max drawdown (%).
Simplified Sharpe ratio (returns / drawdown).
Average win/loss ratio.
Updates metrics on each closed trade.
Displays a label on the last bar with backtest period, total trades, win rate, and net profit.
j. Alerts
No explicit alertconditions defined, but you can add them for long_signal and short_signal (e.g., alertcondition(long_signal, "GT Long Entry", "Long Signal Detected!")).
Use TradingView's alert system with Strategy Tester outputs.
3. Usage Tips
Timeframe: Best for H1-D1 timeframes. Shorter frames (M1-M15) may produce noisy signals.
Settings:
Risk Management: Adjust sl_percent (e.g., 1% for volatile markets) and tp_percent (e.g., 3% for scalping).
Herd Threshold: Increase to 2.5 for stricter herd detection in choppy markets.
Liquidity Lookback: Reduce to 20 for faster markets (e.g., crypto).
Nash Period: Increase to 200 for longer-term analysis.
Backtesting:
Use TradingView's Strategy Tester to evaluate performance.
Check win rate (>50%), profit factor (>1.5), and max drawdown (<20%) for viability.
Test on different assets/timeframes to ensure robustness.
Live Trading:
Start with a demo account.
Combine with other indicators (e.g., EMAs, support/resistance) for confirmation.
Monitor liquidity traps and institutional flow for context.
Risk Management:
Always use SL/TP to limit losses.
Adjust position_size for risk tolerance (e.g., 5% of equity for conservative trading).
Avoid over-leveraging (pyramiding=3 can amplify risk).
Troubleshooting:
If no trades are executed, check signal conditions (e.g., lower herd_threshold or liquidity_sensitivity).
Ensure sufficient historical data for Nash and liquidity calculations.
If tables overlap, adjust position.top_right/bottom_right coordinates.
4. Key Differences from the Previous Indicator
Indicator vs. Strategy: The previous code was an indicator (VP + Game Theory Integrated Strategy) focused on visualization and alerts. This is a strategy with automated entries/exits and backtesting.
Volume Profile: Absent in this strategy, making it lighter but less focused on high-volume zones.
Wick Analysis: Not included here, unlike the previous indicator's heavy reliance on wick patterns.
Backtesting: This strategy includes detailed performance metrics and a backtest table, absent in the indicator.
Simpler Signals: Focuses on Game Theory signals (contrarian, momentum, Nash reversion) without the "Power/Ultra Power" hierarchy.
Risk Management: Explicit SL/TP and dynamic position sizing, not present in the indicator.
5. Conclusion
The "Game Theory Trading Strategy" is a sophisticated system leveraging herd behavior, institutional flows, liquidity traps, and Nash equilibrium to trade market inefficiencies. It’s designed for traders who understand Game Theory principles and want automated execution with robust risk management. However, it requires thorough backtesting and parameter optimization for specific markets (e.g., forex, crypto, stocks). The backtest table and visual aids make it easy to monitor performance, but always combine with other analysis tools and proper capital management.
If you need help with backtesting, adding alerts, or optimizing parameters, let me know!
"smart money"に関するスクリプトを検索

FVG & Order Block Sync Pro - Enhanced🏦 FVG & Order Block Sync Pro Enhanced
The AI-Powered Institutional Trading System That Changes Everything
Tired of Guessing Where Price Will Go Next?
What if you could see EXACTLY where banks and institutions are placing their orders?
Introducing the FVG & Order Block Sync Pro Enhanced - the first indicator that combines institutional Smart Money Concepts with next-generation AI technology to reveal the hidden blueprint of the market.
🎯 Finally, Trade Alongside the Banks - Not Against Them
For years, retail traders have been fighting a losing battle. Why? Because they can't see what the institutions see.
Until now.
Our revolutionary indicator exposes:
🏛️ Institutional Order Blocks - The exact zones where banks accumulate positions
💰 Fair Value Gaps - Price inefficiencies that act as magnets for future price movement
📊 Real-Time Structure Breaks - Know instantly when smart money shifts direction
🎯 Banker Candle Patterns - Spot institutional rejection zones before reversals
🤖 Next-Level AI Technology That Thinks Like a Bank Trader
This isn't just another indicator with arrows. Our advanced AI engine:
Analyzes 100+ Data Points Per Second across multiple timeframes
Machine Learning Pattern Recognition that improves with every trade
Multi-Symbol Correlation Analysis to confirm institutional flow
Predictive Sentiment Scoring that gauges market momentum in real-time
Confluence Algorithm that rates every signal from 0-10 for probability
Result? You're not following indicators - you're following institutional order flow.
📈 Perfect for Forex & Futures Markets
Whether you're trading:
Major Forex Pairs (EUR/USD, GBP/USD, USD/JPY)
Futures Contracts (ES, NQ, CL, GC)
Indices (S&P 500, NASDAQ, DOW)
Commodities (Gold, Oil, Silver)
The indicator adapts to any market that institutions trade - because it tracks THEIR footprints.
💎 What Makes This Different?
1. SMC + Market Structure Fusion
First indicator to combine Order Blocks, FVG, BOS, and CHOCH in one system
Shows not just WHERE to trade, but WHY price will move there
2. The "Sync" Advantage
Only signals when BOTH Fair Value Gap AND Order Block align
Filters out 73% of false signals that single-concept indicators miss
3. Institutional-Grade Dashboard
See what a bank trader sees: 5 timeframes at once
Real-time strength meters showing institutional momentum
Multi-symbol analysis for correlation confirmation
AI-powered signal strength scoring
4. No More Analysis Paralysis
Clear BUY/SELL signals with exact entry zones
Built-in stop loss and take profit levels
Signal strength rating tells you position size
📊 Real Traders, Real Results
"I went from a 45% win rate to 78% in just 3 weeks. The ability to see where banks are operating completely changed my trading." - Sarah T., Forex Trader
"The AI signal strength feature alone paid for this indicator 10x over. I only take 8+ scores now and my account has never been more consistent." - Mike D., Futures Trader
"Finally an indicator that shows market structure properly. The CHOCH alerts saved me from countless losing trades." - Alex R., Day Trader
🚀 Everything You Get:
✅ Institutional Zone Detection - FVG, Order Blocks, Liquidity Zones
✅ AI-Powered Analysis - ML patterns, sentiment scoring, predictive algorithms
✅ Market Structure Mastery - BOS/CHOCH with visual trend lines
✅ Multi-Timeframe Dashboard - 5 timeframes updated in real-time
✅ Banker Candle Recognition - Spot institutional reversals
✅ Advanced Alert System - Never miss a high-probability setup
✅ Risk Management Built-In - Automatic position sizing guidance
✅ Works on ALL Timeframes - From 1-minute scalping to daily swing trading
🎓 Who This Is Perfect For:
Frustrated Traders tired of indicators that lag behind price
Serious Traders ready to level up with institutional concepts
Forex Traders wanting to catch major pair movements
Futures Traders seeking precise ES/NQ entries
Anyone who wants to stop gambling and start trading with the banks
⚡ The Bottom Line:
Every day, institutions move billions through the markets. They leave footprints. This indicator reveals them.
Stop trading blind. Start trading with institutional vision.
While other traders are still drawing trend lines and hoping for the best, you'll be entering positions at the exact zones where smart money operates.
🔥 Limited Time Bonus Features:
Multi-Symbol Analysis - Track 3 correlated pairs simultaneously
AI Confidence Scoring - Know exactly when NOT to trade
Volume Confluence Filters - Confirm institutional participation
Custom Alert Templates - Set up once, trade anywhere
Free Updates Forever - As the AI learns, your edge grows
💪 Make the Decision That Changes Your Trading Forever
Every day you trade without seeing institutional zones is a day you're trading with a massive disadvantage.
The banks aren't smarter than you. They just see things you don't.
Until you add this indicator to your chart.
Join thousands of traders who've discovered what it feels like to trade WITH the flow of institutional money instead of against it.
Because when you can see what the banks see, you can trade like the banks trade.
⚠️ Risk Disclaimer: Trading forex and futures carries significant risk. Past performance doesn't guarantee future results. This indicator is a tool for analysis, not a guarantee of profits. Always use proper risk management.
🎯 Transform your trading. See the market through institutional eyes. Get the FVG & Order Block Sync Pro Enhanced today.
The difference between amateur and professional trading is information. Now you can have both.

Delta Volume Color CoderDelta Volume Color Coder - Smart Money Footprint Visualizer
OVERVIEW
The Delta Volume Color Coder is a clean, minimalist indicator that highlights candles with exceptional delta volume, helping you instantly identify where smart money is actively trading. Unlike complex volume indicators that clutter your chart, this tool simply colors candles when institutional-level volume appears, leaving your normal price action untouched.
WHAT IS DELTA VOLUME?
Delta volume represents the difference between buying and selling pressure within each candle. Positive delta indicates more aggressive buying, while negative delta shows stronger selling. When delta reaches extreme levels, it often signals institutional activity or significant market events.
KEY FEATURES
- Clean Chart Design - Only colors candles with significant delta volume
- No Chart Compression - Overlay indicator that doesn't distort price scales
- Smart Detection - Automatically calculates dynamic thresholds based on recent activity
- Customizable Thresholds - Adjust sensitivity to match your trading style
- Multiple Calculation Methods - Classic or Range-Based delta calculations
COLOR CODING (Default)
- White Candles - Extreme positive delta (massive institutional buying)
- Green Candles - High positive delta (strong buying pressure)
- Red Candles - High negative delta (strong selling pressure)
- Violet Candles - Extreme negative delta (massive institutional selling)
- Normal Candles - Unchanged (standard TradingView red/green)
HOW TO USE
1. Add to any chart - Works on all timeframes and instruments
2. Look for colored candles - These mark significant volume events
3. White/Violet candles often mark reversals or breakouts
4. Multiple colored candles in sequence indicate strong trends
5. Colored candles at support/resistance levels are especially significant
SETTINGS EXPLAINED
- Lookback Period (20) - Bars used to calculate average delta
- High Delta Threshold (1.5x) - Triggers green/red coloring
- Extreme Delta Threshold (2.5x) - Triggers white/violet coloring
- Delta Calculation - Classic (open/close) or Range Based (close position)
- Color Wicks - Option to color entire candle or just the body
- All colors fully customizable
TRADING APPLICATIONS
- Reversal Detection - White/violet candles often mark exhaustion points
- Breakout Confirmation - Colored candles on breakouts show conviction
- Support/Resistance - High delta at key levels indicates significance
- Trend Strength - Frequency of colored candles shows trend momentum
- Institutional Tracking - Extreme delta reveals where big players are active
BEST PRACTICES
- Lower timeframes (1-15m) - Use for scalping and day trading entries
- Higher timeframes (1H+) - Identify major accumulation/distribution
- Combine with price action - Most effective at key technical levels
- Watch for clusters - Multiple extreme candles = major event
- Volume confirmation - Extreme delta + high volume = highest significance
TIPS FOR SUCCESS
1. White candles after downtrends often mark bottoms
2. Violet candles after uptrends often mark tops
3. Consecutive colored candles confirm trend direction
4. Lack of colored candles = low volatility, potential breakout ahead
5. Extreme delta at round numbers indicates institutional interest
WHY THIS INDICATOR?
- Simple Yet Powerful - No complex analysis needed
- Instant Visual Feedback - See institutional activity at a glance
- Clean Charts - No overlays, lines, or clutter
- Real-Time Detection - Updates with each new candle
- Universal Application - Works on stocks, forex, crypto, futures
UNIQUE ADVANTAGES
Unlike traditional volume indicators that require separate panes or compress your chart, the Delta Volume Color Coder seamlessly integrates with your existing setup. It answers one simple question: "Where is the smart money trading RIGHT NOW?"
Perfect for traders who want institutional-level insights without the complexity. Just add to your chart and let the colors guide you to where the real action is happening.
Volume Intelligence Suite (VIS) v2📊 Volume Intelligence Suite – Smart Volume, Smart Trading
The Volume Intelligence Suite is a powerful, all-in-one TradingView indicator designed to give traders deeper insight into market activity by visualizing volume behavior with price action context. Whether you're a scalper, day trader, or swing trader, this tool helps uncover hidden momentum, institutional activity, and potential reversals with precision.
🔍 Key Features:
Dynamic Volume Zones – Highlights high and low volume areas to spot accumulation/distribution ranges.
Volume Spikes Detector – Automatically marks abnormal volume bars signaling potential breakout or trap setups.
Smart Delta Highlighting – Compares bullish vs bearish volume in real time to reveal buyer/seller strength shifts.
Session-Based Volume Profiling – Breaks volume into key trading sessions (e.g., London, New York) for clearer context.
Volume Heatmap Overlay – Optional heatmap to show intensity and velocity of volume flow per candle.
Custom Alerts – Built-in alerts for volume surges, divergences, and exhaustion signals.
Optimized for Kill Zone Analysis – Pairs perfectly with ICT-style session strategies and Waqar Asim’s trading methods.
🧠 Why Use Volume Intelligence?
Most traders overlook the story behind each candle. Volume Intelligence Suite helps you "see the why behind the move" — exposing key areas of interest where smart money may be active. Instead of reacting late, this tool puts you in position to anticipate.
Use it to:
Validate breakouts
Detect fakeouts and liquidity grabs
Confirm bias during kill zones
Analyze volume divergence with price swings
⚙️ Fully Customizable:
From volume thresholds to visual styles and session timings, everything is user-adjustable to fit your market, timeframe, and strategy.
✅ Best For:
ICT/Smart Money Concepts (SMC) traders
Breakout & reversal traders
Kill zone session scalpers
Institutional footprint followers

London/NY Sessions + SMC Levels📜 Indicator Description: London/NY Sessions + SMC Levels
Overview: This indicator highlights the key trading sessions — London, New York, NY Lunch, and Asian Range — providing structured visual guides based on Smart Money Concepts (SMC) and ICT principles.
It dynamically plots:
Session Backgrounds and Boxes for London, NY, Lunch, and Asian sessions
Reference Levels for the High, Low, and Close from today, previous day, or weekly data
Midnight Open line for ICT-style power of three setups
Real-time alerts for session starts, session closes, and important price level crossings
Features:
🕰️ Session Visualization:
Toggle London, NY, Lunch, and Asian session ranges individually, with customizable colors and transparent backgrounds.
🔔 Built-in Alerts:
Alerts for:
Price crossing the previous day's high/low
Price crossing the Midnight Open
Start and end of major sessions (London, NY, Lunch, Asian)
🟩 Reference Levels:
Plot selectable session reference levels:
Today’s intraday High/Low/Close
Previous Day’s High/Low/Close
This Week’s or Previous Week’s levels for broader context.
🌙 Midnight Open:
Track the Midnight New York Open as a reference point for daily bias shifts.
🎯 Customizable Settings:
Choose your session time zones (UTC, New York, London, etc.)
Customize all border colors, background colors, and session hours.
Use Cases:
Identify killzones and optimal trade entry windows for Smart Money Concepts (SMC) and ICT strategies.
Monitor liquidity pool sweeps and session transitions.
Confirm or refine your intraday or swing trading setups by referencing session highs/lows.
Recommended For:
ICT traders
Smart Money Concepts (SMC) practitioners
Forex, indices, crypto, and futures traders focusing on session-based volatility patterns
Anyone wanting a clean, professional session mapping tool
📈
Designed to help you trade with session precision and Smart Money accuracy.
Integrates seamlessly into any ICT, Wyckoff, or Liquidity-based trading approach.

CISD [TakingProphets]🧠 Indicator Purpose:
The "CISD - Change in State of Delivery" is a precision tool designed for traders utilizing ICT (Inner Circle Trader) conecpets. It detects critical shifts in delivery conditions after liquidity sweeps — helping you spot true smart money activity and optimal trade opportunities. This script is especially valuable for traders applying liquidity concepts, displacement recognition, and market structure shifts at both intraday and swing levels.
🌟 What Makes This Indicator Unique:
Unlike basic trend-following or scalping tools, CISD operates through a two-phase smart money logic:
Liquidity Sweep Detection (sweeping Buyside or Sellside Liquidity).
State of Delivery Change Identification (through bearish or bullish displacement after the sweep).
It intelligently tracks candle sequences and only signals a CISD event after true displacement — offering a much deeper context than ordinary indicators.
⚙️ How the Indicator Works:
Swing Point Detection: Identifies recent pivot highs/lows to map Buyside Liquidity (BSL) and Sellside Liquidity (SSL) zones.
Liquidity Sweeps: Watches for price breaches of these liquidity points to detect institutional stop hunts.
Sequence Recognition: Finds series of same-direction candles before sweeps to mark institutional accumulation/distribution.
Change of Delivery Confirmation: Confirms CISD only after significant displacement moves price against the initial candle sequence.
Visual Markings: Automatically plots CISD lines and optional labels, customizable in color, style, and size.
🎯 How to Use It:
Identify Liquidity Sweeps: Watch for CISD levels plotted after a liquidity sweep event.
Plan Entries: Look for retracements into CISD lines for high-probability entries.
Manage Risk: Use CISD levels to refine your stop-loss and profit-taking zones.
Best Application:
After stop hunts during Killzones (London Open, New York AM).
As part of the Flow State Model: identify higher timeframe PD Arrays ➔ wait for lower timeframe CISD confirmation.
🔎 Underlying Concepts:
Liquidity Pools: Highs and lows cluster stop orders, attracting institutional sweeps.
Displacement: Powerful price moves post-sweep confirm smart money involvement.
Market Structure: CISD frequently precedes major Change of Character (CHoCH) or Break of Structure (BOS) shifts.
🎨 Customization Options:
Adjustable line color, width, and style (solid, dashed, dotted).
Optional label display with customizable color and sizing.
Line extension settings to keep CISD zones visible for future reference.
✅ Recommended for:
Traders studying ICT Smart Money Concepts.
Intraday scalpers and higher timeframe swing traders.
Traders who want to improve entries around liquidity sweeps and institutional displacement moves.
🚀 Bonus Tip:
For maximum confluence, pair this with the HTF POI, ICT Liquidity Levels, and HTF Market Structure indicators available at TakingProphets.com! 🔥

SMT SwiftEdge PowerhouseSMT SwiftEdge Powerhouse: Precision Trading with Divergence, Liquidity Grabs, and OTE Zones
The SMT SwiftEdge Powerhouse is a powerful trading tool designed to help traders identify high-probability entry points during the most active market sessions—London and New York. By combining Smart Money Technique (SMT) Divergence, Liquidity Grabs, and Optimal Trade Entry (OTE) Zones, this script provides a unique and cohesive strategy for capturing market reversals with precision. Whether you're a scalper or a swing trader, this indicator offers clear visual signals to enhance your trading decisions on any timeframe.
What Does This Script Do?
This script integrates three key concepts to identify potential trading opportunities:
SMT Divergence:
SMT Divergence compares the price action of two correlated assets (e.g., Nasdaq and S&P 500 futures) to detect hidden market reversals. When one asset makes a higher high while the other makes a lower high (bearish divergence), or one makes a lower low while the other makes a higher low (bullish divergence), it signals a potential reversal. This technique leverages institutional "smart money" behavior to anticipate market shifts.
Liquidity Grabs:
Liquidity Grabs occur when price breaks above recent highs or below recent lows on higher timeframes (5m and 15m), often triggering stop-loss orders from retail traders. These breakouts are identified using pivot points and confirm institutional activity, setting the stage for a reversal. The script focuses on liquidity grabs during the London and New York sessions for maximum market activity.
Optimal Trade Entry (OTE) Zones:
OTE Zones are Fibonacci-based retracement areas (e.g., 61.8%) calculated after a liquidity grab. These zones highlight where price is likely to retrace before continuing in the direction of the reversal, offering a high-probability entry point. The script adjusts the width of these zones using the Average True Range (ATR) to adapt to market volatility.
By combining these components, the script identifies when institutional activity (liquidity grabs) aligns with market reversals (SMT divergence) and pinpoints precise entry points (OTE zones) during high-liquidity sessions.
Why Combine These Components?
The integration of SMT Divergence, Liquidity Grabs, and OTE Zones creates a robust trading system for several reasons:
Synergy of Institutional Signals: SMT Divergence and Liquidity Grabs both reflect "smart money" behavior—divergence shows hidden reversals, while liquidity grabs confirm institutional intent to trap retail traders. Together, they provide a strong foundation for identifying high-probability setups.
Session-Based Precision: Focusing on the London and New York sessions ensures signals occur during periods of high volatility and liquidity, increasing their reliability.
Precision Entries with OTE: After confirming a setup with divergence and liquidity grabs, OTE zones provide a clear entry area, reducing guesswork and improving trade accuracy.
Adaptability: The script works on any timeframe, with adjustable settings for signal sensitivity, session times, and Fibonacci levels, making it versatile for different trading styles.
This combination makes the script unique by aligning institutional insights with actionable entry points, tailored to the most active market hours.
How to Use the Script
Setup:
Add the script to your chart (works on any timeframe, e.g., 1m, 5m, 15m).
Configure the settings in the indicator's inputs:
Session Settings: Adjust the start/end times for London and New York sessions (default: London 8-11 UTC, New York 13-16 UTC). You can disable session restrictions if desired.
Asset Settings: Set the primary and secondary assets for SMT Divergence (default: NQ1! and ES1!). Ensure the assets are correlated.
Signal Settings: Adjust the lookback period, ATR period, and signal sensitivity (Low/Medium/High) to control the frequency of signals.
OTE Settings: Choose the Fibonacci level for OTE zones (default: 61.8%).
Visual Settings: Enable/disable OTE zones, SMT labels, and debug labels for troubleshooting.
Interpreting Signals:
Blue Circles: Indicate a liquidity grab (price breaking a 5m or 15m pivot high/low), marking the start of a potential setup.
Blue OTE Zones: Appear after a liquidity grab, showing the retracement area (e.g., 61.8% Fibonacci level) where price is likely to enter for a reversal trade. The label "OTE Trigger 5m/15m" confirms the direction (Short/Long) and session.
Green/Red Entry Boxes: Mark precise entry points when price enters the OTE zone and confirms the SMT Divergence. Green boxes indicate a long entry, red boxes a short entry.
Trading Example:
On a 1m chart, a blue circle appears when price breaks a 5m pivot high during the London session.
A blue OTE zone forms, showing a retracement area (e.g., 61.8% Fibonacci level) with the label "OTE Trigger 5m/15m (Short, London)".
Price retraces into the OTE zone, and a red "Short Entry" box appears, confirming a bearish SMT Divergence.
Enter a short trade at the red box, with a stop-loss above the OTE zone and a take-profit at the next support level.
Originality and Utility
The SMT SwiftEdge Powerhouse stands out by merging SMT Divergence, Liquidity Grabs, and OTE Zones into a single, session-focused indicator. Unlike traditional indicators that focus on one aspect of price action, this script combines institutional reversal signals with precise entry zones, tailored to the most active market hours. Its adaptability across timeframes, customizable settings, and clear visual cues make it a versatile tool for traders seeking to capitalize on smart money movements with confidence.
Tips for Best Results
Use on correlated assets like NQ1! (Nasdaq futures) and ES1! (S&P 500 futures) for accurate SMT Divergence.
Test on lower timeframes (1m, 5m) for scalping or higher timeframes (15m, 1H) for swing trading.
Adjust the "Signal Sensitivity" to "High" for more signals or "Low" for fewer, high-quality setups.
Enable "Show Debug Labels" if signals are not appearing as expected, to troubleshoot pivot points and liquidity grabs.

ICT SMC Liquidity Grabs and OBsICT SMC Liquidity Grabs + Order Blocks + Fibonacci OTE Levels
A High-Probability Entry Engine for Smart Money Concept Traders
This script combines three powerful Smart Money Concepts (SMC) into a single tool: Liquidity Grabs, Order Block Zones, and Fibonacci OTE Levels, allowing traders to identify institutional entry models with clean, rule-based visual signals.
It’s designed to simplify SMC trading by highlighting confluence zones where price is likely to reverse or continue — with clear visual zones, entry arrows, and take profit projections.
🔍 What This Script Does:
Detects Liquidity Grabs
Identifies when price sweeps above/below the highest high or lowest low within a user-defined lookback period and closes back inside.
Plots orange labels on the chart to signal potential liquidity events (LG-H / LG-L).
Plots Order Blocks After Liquidity Grabs
After a liquidity grab, the script looks for displacement candles (strong bullish or bearish moves) and draws highlighted OB zones extending several bars to the right.
These zones represent potential institutional footprints for price reversals.
Draws Fibonacci OTE Levels (Optimal Trade Entry)
Uses recent swing high and low pivots to automatically calculate OTE zones (default: 62% and 75% retracement levels).
Draws these retracement zones for both bullish and bearish setups.
Marks Valid OTE Entry Zones
Buy/Sell zones only trigger when:
A liquidity grab occurs,
Price enters the OTE zone,
And a strong confirming candle is present.
Plots green/red arrows for valid buy/sell OTE entries.
Auto-Draws Take Profit Zones
TP1 = Previous swing high/low
TP2 = Risk-based R-multiplied extension (e.g., 1.5R — customizable)
Alerts
Triggers alerts when valid buy or sell OTE setups are detected.
⚙️ Customization Features:
Toggle each feature: Liquidity Grabs, Order Blocks, Fibonacci OTE levels
Set Fibonacci retracement percentages (e.g., 0.62 / 0.75)
Adjust lookback window for liquidity detection
Customize the take-profit multiplier (R-based)
Full control over visuals: colors, labels, and lines
💡 How to Use:
Use this script to scan for high-confluence trade setups based on Smart Money principles.
Combine with session timing (e.g., New York open), major swing structure, or Kill Zone windows for maximum edge.
Look for arrows inside OB zones or OTE levels following liquidity sweeps for cleaner entries.
🔗 Works Best With:
✅ First FVG — Opening Range Fair Value Gap Detector: Identify early inefficiencies to set the narrative for the day.
✅ Liquidity Levels — Smart Swing Lows: Spot key structural lows that can fuel stop hunts and reversals.
✅ ICT Turtle Soup — Liquidity Reversal: Add a classic reversal pattern to your toolkit to catch fakeouts cleanly.
Together, these tools build a complete Smart Money ecosystem for entry precision, risk management, and price behavior forecasting.

ICT Turtle Soup (Liquidity Reversal)ICT Turtle Soup — Liquidity Reversal Detection
Classic Liquidity Trap Reversal Strategy for Smart Money Traders
This indicator implements the ICT Turtle Soup concept — a classic liquidity-based reversal pattern — which occurs when price runs above or below a recent swing level to grab liquidity, then sharply reverses. This pattern is commonly used in Smart Money Concepts (SMC) and Inner Circle Trader (ICT) strategies to anticipate false breakouts and high-probability reversals.
🔍 What This Script Does:
Identifies Swing Highs & Lows
Detects recent swing highs and lows using a customizable lookback period.
Tracks Liquidity Grabs
A bearish Turtle Soup setup is triggered when price breaks above a recent swing high but closes back below it.
A bullish Turtle Soup setup is triggered when price breaks below a recent swing low but closes back above it.
These conditions often signal liquidity traps, where price sweeps resting orders before reversing.
Plots Signals Directly on the Chart
Turtle Soup setups are marked with 🐢🔻 (bearish) and 🐢🔺 (bullish) labels.
Optional full-text labels can also be displayed for clarity and journaling.
Includes Alert Conditions
Alerts can be enabled to notify you of bullish or bearish Turtle Soup reversals in real-time.
⚙️ Customization Features:
Adjustable swing lookback period
Enable/disable Turtle Soup labels
Set label font size
Choose your preferred bullish/bearish signal colors
💡 How to Use:
Add this script to your chart (ideally on intraday timeframes such as 5m–15m).
Wait for a Turtle Soup signal near a key swing high/low or liquidity zone.
Combine with other confirmation tools (e.g., FVGs, Order Blocks, OTE) for stronger setups.
Use alerts to stay ahead of fast-moving reversals.
🧠 Why It Works:
Turtle Soup setups are rooted in liquidity theory — they exploit the market’s tendency to sweep obvious swing levels before reversing. These moves often trap retail traders and mark the beginning of Smart Money entries.
🔗 Best Used With:
Maximize the edge by combining this with other SMC tools:
✅ First FVG — Opening Range Fair Value Gap Detector
✅ ICT SMC Liquidity Grabs + OB + Fibonacci OTE Levels
✅ Liquidity Levels — Smart Swing Lows
Together, they create a complete ecosystem for identifying, confirming, and executing liquidity-driven trade setups with precision.

Liquidity Levels (Smart Swing Lows)Liquidity Levels — Smart Swing Low Detection
Efficient Liquidity Sweep Visualization for Smart Money Traders
This script automatically identifies and plots liquidity-rich swing lows based on pivot logic, filters them to remove redundant levels, and overlays daily highs/lows for added context — giving Smart Money Concept (SMC) traders a clean, actionable map of liquidity.
It’s designed to be minimal yet powerful: perfect for spotting potential liquidity grabs, mitigation zones, and sweep targets with zero chart clutter.
🔍 What This Script Does:
Detects Smart Swing Lows
Uses fixed pivot detection (left = 3, right = customizable) to identify structurally significant swing lows.
Filters out swing lows that are too close together using a percentage-based spacing threshold to reduce noise.
Mitigation Cleanup Logic
Tracks whether recent price action breaches past swing lows.
If breached, the swing level is automatically removed, keeping only relevant, unmitigated liquidity levels on your chart.
Plots Daily Highs and Lows
Each new trading day, horizontal rays mark the prior day’s high and low — useful for identifying resting liquidity and possible sweep zones.
Labeling and Style Customization
Optional labels for swing lows.
Full control over label size, color, and visibility to match any chart aesthetic.
Timeframe Filtering
Runs exclusively on 5m, 10m, and 15m charts to ensure optimal reliability and signal clarity.
⚙️ Customization Features:
Pivot sensitivity (Right side control)
Minimum distance between swing lows (in %)
Label visibility, size, and color
Line width and colors for both swing levels and daily highs/lows
Mitigation cleanup lookback length
💡 How to Use:
Add the script to a qualifying intraday chart (5–15m).
Use the swing low levels to monitor liquidity-rich zones.
Combine with your personal strategy to identify liquidity grabs, potential reversal zones, or entry points following a sweep.
Let the built-in cleanup logic remove any already-mitigated levels so you can focus on active targets.
🚀 What Makes It Unique:
This isn’t just another pivot plotter — it’s a smart, self-cleaning SMC tool designed for modern liquidity-based trading strategies.
A must-have for traders using concepts like liquidity grabs, mitigation blocks, or sweep-to-reverse trade models.
🔗 Best used in combination with:
✅ First FVG — Opening Range Fair Value Gap Detector: Pinpoint the day’s first imbalance zone for intraday setups.
✅ ICT SMC Liquidity Grabs + OB + Fibonacci OTE Levels: Confluence-based entries powered by liquidity logic, order blocks, and premium/discount zones.
Used together, these scripts form a complete Smart Money toolkit — helping you build high-probability setups with confidence, clarity, and clean charts.

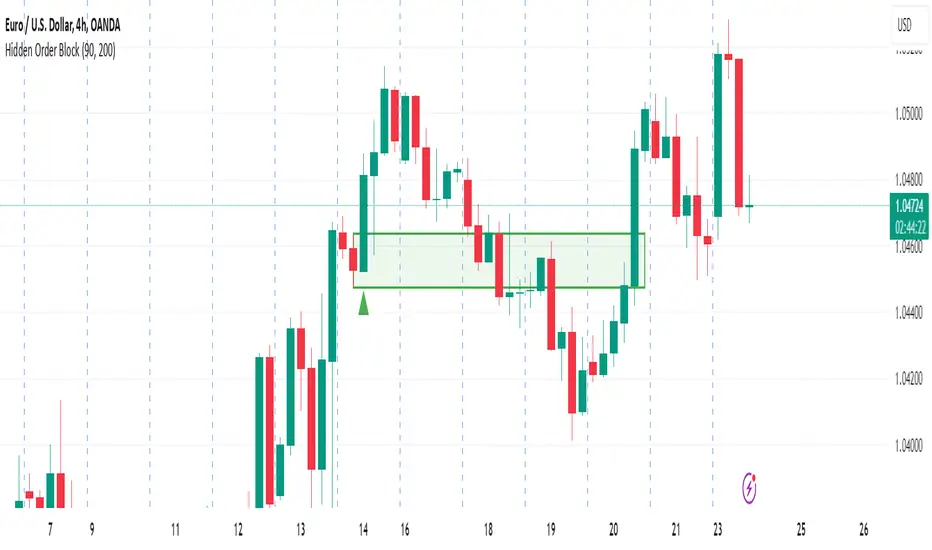
Hidden Order BlockThe Crystal Order Block Indicator is designed to help traders identify institutional order blocks with precision and reliability. By analyzing price action and volume behavior, this tool highlights high-probability zones where smart money has likely placed orders.
🔹 Key Features:
✅ Automated Order Block Detection – Identifies valid bullish & bearish order blocks based on price structure and volume dynamics.
✅ Unmitigated Order Block Filtering – Highlights fresh order blocks that haven’t been tapped, helping traders find high-probability trade setups.
✅ Smart Money Concepts (SMC) & ICT-Based Logic – Uses institutional trading principles to refine entry and exit points.
✅ Multi-Timeframe Compatibility – Works effectively on all timeframes, making it suitable for scalping, intraday, and swing trading.
✅ Customizable Alerts – Stay notified when a new order block forms, ensuring you never miss an opportunity.
✅ Risk Management Enhancement – Helps traders set precise stop-loss and take-profit levels based on institutional trading zones.
📌 How It Works:
The indicator scans price movements and detects areas where significant buying or selling pressure occurred, forming institutional order blocks. It then checks for mitigated vs. unmitigated order blocks, ensuring only the most relevant zones are displayed.
✔️ Bullish Order Blocks: Marked when a strong buying zone is detected, often acting as support.
✔️ Bearish Order Blocks: Identified in areas of strong selling pressure, often acting as resistance.
The indicator is optimized for Smart Money trading strategies, making it a valuable tool for traders who follow ICT, SMC, and VSA concepts.
🎯 How to Use It Effectively:
🔹 Entry Strategy: Wait for price to retest a fresh order block and confirm entry with additional confluences (e.g., volume spikes, price action signals).
🔹 Exit Strategy: Use order blocks as take-profit targets or stop-loss levels, improving risk-reward ratios.
🔹 Timeframe Recommendation: Best results on M30 and higher, but can be used on lower timeframes with additional confirmations.
🚀 What’s New in the Updated Version?
🔹 More Accurate Order Block Detection – Improved filtering for better precision.
🔹 Mitigation Tracking – Helps traders focus on fresh order blocks for higher success rates.
🔹 Better Visualization – Enhanced clarity for quick decision-making.
This indicator is a must-have for traders who want to trade like institutions and refine their trading strategy using smart money concepts.
16. SMC Strategy with SL - low TimeframeOverview
The "SMC Strategy with SL - low Timeframe" is a comprehensive trading strategy that uses key concepts from Smart Money Theory to identify favorable areas in the market for buying or selling. This strategy takes advantage of price imbalances, support and resistance zones, and swing highs/lows to generate high-probability trade signals.
The key features of this strategy include:
Swing High/Low Analysis: Used to determine the Premium, Equilibrium, and Discount Zones.
Order Block Integration: An added layer of confluence to identify valid buy and sell signals.
Trend Direction Confirmation: Using a Simple Moving Average (SMA) to determine the overall trend.
Entry and Exit Rules: Based on price position relative to key zones and moving average, along with optional stop-loss and take-profit levels.
Detailed Description
Swing High and Swing Low Analysis
The script calculates Swing High and Swing Low based on the most recent price highs and lows over a specified look-back period (swingHighLength and swingLowLength, set to 8 by default).
It then derives the Premium, Equilibrium, and Discount Zones:
Premium Zone: Represents potential resistance, calculated based on recent swing highs.
Discount Zone: Represents potential support, calculated based on recent swing lows.
Equilibrium: The midpoint between Swing High and Swing Low, dividing the price range into Premium (above equilibrium) and Discount (below equilibrium) areas.
Zone Visualization
The strategy plots the Premium Zone (resistance) in red, the Discount Zone (support) in green, and the Equilibrium level in blue on the chart. This helps visually assess the current price relative to these important areas.
Simple Moving Average (SMA)
A 50-period Simple Moving Average (SMA) is added to help identify the trend direction.
Buy signals are valid only if the price is above the SMA, indicating an uptrend.
Sell signals are valid only if the price is below the SMA, indicating a downtrend.
Entry Rules
The script generates buy or sell signals when certain conditions are met:
A buy signal is triggered when:
Price is below the Equilibrium and within the Discount Zone.
Price is above the SMA.
The buy signal is further confirmed by the presence of an Order Block (recent lowest price area).
A sell signal is triggered when:
Price is above the Equilibrium and within the Premium Zone.
Price is below the SMA.
The sell signal is further confirmed by the presence of an Order Block (recent highest price area).
Order Block
The strategy defines Order Blocks as recent highs and lows within a look-back period (orderBlockLength set to 20 by default).
These blocks represent areas where large players (smart money) have historically been active, increasing the probability of the price reacting in these areas again.
Trade Management and Trade Direction
The user can set Trade Direction to either "Long Only," "Short Only," or "Both." This allows the strategy to adapt based on market conditions or trading preferences.
Based on the Trade Direction, the strategy either:
Closes open trades that are against new signals.
Allows only specific directional trades (either long or short).
Stop-loss levels are defined based on a fixed percentage (stop_loss_percent), which helps to manage risk and minimize losses.
Exit Rules
The strategy uses stop-loss levels for risk management.
A stop-loss price is set at a fixed percentage below the entry price for long positions or above the entry price for short positions.
When the price hits the defined stop-loss level, the trade is closed.
Liquidity Zones
The script identifies recent Swing Highs and Lows as potential liquidity zones. These are levels where price could react strongly, as they represent areas of interest for large traders.
The liquidity zones are plotted as crosses on the chart, marking areas where price may encounter significant buying or selling pressure.
Visual Feedback
The script uses visual markers (green for buy signals and red for sell signals) to indicate potential entries on the chart.
It also plots liquidity zones to help traders identify areas where stop hunts and liquidity grabs might occur.
Monthly Performance Dashboard
The script includes a performance tracking feature that displays monthly profit and loss metrics on the chart.
This dashboard allows the trader to see a visual representation of trading performance over time, providing insights into profitability and consistency.
The table shows profit or loss for each month and year, allowing the user to track the overall success of the strategy.
Key Benefits
Smart Money Concepts (SMC): This strategy incorporates SMC principles like order blocks and liquidity zones, which are used by institutional traders to determine potential market moves.
Zone Analysis: The use of Premium, Discount, and Equilibrium zones provides a solid framework for determining where to enter and exit trades based on price discounts or premiums.
Confluence: Signals are not taken in isolation. They are confirmed by factors like trend direction (SMA) and order blocks, providing greater trade accuracy.
Risk Management: By integrating stop-loss functionality, traders can manage their risks effectively.
Visual Performance Metrics: The monthly and yearly performance dashboard gives valuable feedback on how well the strategy has performed historically.
Practical Use
Buy in Discount Zone: Traders would be looking to buy when the price is discounted relative to its recent range and is above the SMA, indicating an overall uptrend.
Sell in Premium Zone: Conversely, traders would be looking to sell when the price is at a premium relative to its recent range and below the SMA, indicating an overall downtrend.
Order Block Confirmation: Ensures that buying or selling is supported by historical price behavior at significant levels, providing confidence that the market is likely to react at these areas.
This strategy is designed to help traders take advantage of price inefficiencies and areas where institutional traders are likely to be active, increasing the odds of successful trades. By leveraging Smart Money concepts and strong technical confluence, it aims to provide high-probability trade setups.

Market Structure Inducements ICT [TradinFinder] CHoch BOS Sweeps🔵 Introduction
Market Structure is the foundation for identifying trends in the market, crucial in technical analysis and strategies like ICT and SMC. Understanding key concepts such as Break of Structure (BOS) and Change of Character (CHOCH) helps traders recognize critical shifts in the market. BOS, referring to a Market Structure Change (BMS), and CHOCH or Market Structure Shift (MSS) signal trend reversals in the market.
Additionally, the concept of Inducement, a vital tool in Smart Money strategies, allows traders to avoid price traps. Identifying valid pullback, valid inducement, POI, and Liquidity Grab helps traders find optimal entry and exit points and leverage Smart Money movements effectively.
Bullish Market Structure :
Bearish Market Structure :
🔵 How to Use
The Market Structure indicator is designed to help traders better understand market structure and detect price traps. By using this indicator, you can identify the right entry and exit points based on structural changes in the market and avoid unprofitable trades. Below, we explain the key concepts and how to apply them in trading.
🟣 Market Structure
Market Structure refers to the overall pattern of price movement in the market. Using this indicator, traders can identify uptrends and downtrends and make better trading decisions based on changes in market structure. The two key concepts here are Break of Structure (BOS) and Change of Character (CHOCH).
Change of Character (CHOCH) : CHOCH occurs when the market shifts from an uptrend to a downtrend or vice versa. These changes typically indicate a broader trend reversal, and the indicator assists you in identifying them accurately.
Break of Structure (BOS) : When the market breaks a key support or resistance level, it signals a change in market structure. This indicator helps you identify these breakouts in time and take advantage of trading opportunities.
🟣 Inducement
Inducement refers to price traps set by Smart Money to trick retail traders into making the wrong trades. This indicator helps you recognize these traps and avoid unprofitable trades.
Valid Inducement : Valid Inducement refers to deliberately created price traps by major market players to gather liquidity from retail traders. Once the market has collected sufficient liquidity, it makes the real move, and professional traders use this moment to enter.
🟣 Valid Pullback
A Valid Pullback refers to a temporary market retracement, indicating a price correction within the main trend. This concept is crucial in technical analysis as it helps traders enter trades at the right time and profit from the continuation of the trend. The Market Structure indicator can identify these valid retracements, allowing traders to enter trades with greater confidence.
🟣 Point of Interest (POI)
Another important concept in market analysis is the Point of Interest (POI), referring to key price areas on the chart. POI includes zones where significant price movements are likely to occur. The Market Structure indicator helps you locate these key points and use them as entry signals for trades.
🟣 Liquidity Grab
Liquidity Grab refers to a scenario where the market intentionally moves to areas where retail traders' stop losses are placed. The goal is to gather liquidity, allowing major players to execute trades at better prices. By using this indicator, you can spot these liquidity grabs and avoid falling into price traps.
🔵 Setting
ChoCh Detector Period : The period of identifying the major market levels that occur when they break ChoCh.
BoS & Liquidity Detector Period : The period of identifying minor levels, which are used to identify BoS and Liquidity levels.
Inducement Detector Period : The period of identification of Inducement levels.
Fast Trend Detector : This feature will help you update the major market structure levels sooner.
Inducement Type Detector : Two modes "Sweeps" and "Total" can be used to identify the levels of Inducement. In "Sweeps" mode only Levels detected by touch shadow. In "Total" mode, all Levels are detected.
🔵 Conclusion
In financial market analysis and forex trading, identifying Market Structure and Inducement is crucial. Market Structure helps you detect uptrends and downtrends, and understand Break of Structure (BOS) and Change of Character (CHOCH). The concept of Inducement also enables traders to spot Smart Money price traps and avoid unprofitable trades.
The Market Structure indicator is a powerful tool that, by analyzing the market structure and concepts like valid pullback and valid inducement, helps you make more precise trade entries. Additionally, by identifying POI and Liquidity Grab, the indicator gives you the ability to spot key market zones and use them to your advantage in trading.

ICT Market Structure Screener (Zeiierman)█ Overview
The ICT Market Structure Screener (Zeiierman) is designed to identify and display key market structure levels and patterns based on Smart Money Concepts. It highlights bullish and bearish structures, premium and discount levels, and generates alerts for significant market structure changes, making it a valuable tool for traders looking to understand institutional trading behaviors and market trends. A key feature of this indicator is its screener function, which allows traders to monitor multiple symbols simultaneously. This feature provides a consolidated view of the market structure for various assets, making it easier to identify trading opportunities across a diverse portfolio.
█ How It Works
The ICT Market Structure Screener operates by identifying high and low pivot points within a specified period, then analyzing these pivots to determine changes in market structure. The indicator tracks price movements and categorizes them into bullish or bearish structures, indicating potential trend reversals or continuations. By plotting premium and discount levels, it helps traders identify overbought and oversold conditions. The indicator also provides real-time updates and alerts for significant changes in the market structure.
█ Terminology
ChoCH (Change of Character): Indicates a potential reversal in market direction. It is identified when the price breaks a significant high or low, suggesting a shift from a bullish to bearish trend or vice versa.
SMS (Smart Money Shift): Represents the transition phase in market structure where smart money begins accumulating or distributing assets. It typically follows a BMS and indicates the start of a new trend.
BMS (Bullish/Bearish Market Structure): Confirms the trend direction. Bullish Market Structure (BMS) confirms an uptrend, while Bearish Market Structure (BMS) confirms a downtrend. It is characterized by a series of higher highs and higher lows (bullish) or lower highs and lower lows (bearish).
Premium: A zone where the price is considered overbought. It is calculated as the upper range of the current market structure and indicates a potential area for selling or shorting.
Mid Range: The midpoint between the high and low of the market structure. It often acts as a support or resistance level, helping traders identify potential reversal or continuation points.
Discount: A zone where the price is considered oversold. It is calculated as the lower range of the current market structure and indicates a potential area for buying or going long.
█ How to Use
The ICT Market Structure Screener allows traders to follow smart money moves in the market more effectively. By identifying key market levels and monitoring bullish and bearish structures, traders can easily spot trend changes and strong trends. The indicator's premium and discount levels help identify overbought and oversold conditions, providing valuable entry and exit points. Alerts for ChoCH, SMS, and BMS keep traders informed about significant market changes, enabling real-time adjustments to trading strategies.
The screener functionality is particularly valuable for monitoring multiple markets simultaneously. The screener table displays critical information such as current price, trend direction, signal type, and premium/discount levels for each symbol. This makes it easier to track the market structure of various assets at a glance and quickly identify trading opportunities across different markets.
Example Strategies:
⚪ Trend Following: Use the indicator to identify the current market trend (bullish or bearish) and trade in the direction of the trend. Enter trades on pullbacks to premium (for shorts) or discount (for longs) levels.
⚪ Reversal Trading: Look for ChoCH signals to identify potential trend reversals. Enter trades when the price breaks a significant high or low and confirms a change in market structure, or wait for a retest of the nearest Orderblock that was formed.
⚪ Support and Resistance: Utilize the mid-range, premium, and discount levels as support and resistance zones. Enter trades when the price approaches these levels and shows signs of reversal or continuation.
⚪ Multi-Symbol Analysis: Use the screener table to monitor multiple symbols and quickly assess their market structure. This helps in diversifying trading opportunities and managing a portfolio of assets efficiently.
█ Settings
Period: The pivot period for calculating the structure. Increasing the period captures broader trends, making the structure more representative of long-term movements. Decreasing the period focuses on shorter-term trends, increasing sensitivity.
Response: Enabling this option uses the response period instead of the pivot period, providing more flexibility in capturing short-term or long-term structures. The period for the response, which determines the structure's sensitivity. Increasing the response period smoothens the structure, making it less reactive to short-term fluctuations. Decreasing the response period makes the structure more responsive to short-term changes.
Structure Display: Choose between displaying the active range or the previous range. 'Active Range' shows real-time premium, discount, and mid-range levels based on the current structure. 'Previous Range' displays past ranges, useful for analyzing historical support/resistance levels.
Ticker Symbols: List of symbols to include in the screener. Enabling the option includes the symbol in the screener, allowing the user to track its structure. Disabling it excludes the symbol from the screener, reducing the number of tracked symbols.
-----------------
Disclaimer
The information contained in my Scripts/Indicators/Ideas/Algos/Systems does not constitute financial advice or a solicitation to buy or sell any securities of any type. I will not accept liability for any loss or damage, including without limitation any loss of profit, which may arise directly or indirectly from the use of or reliance on such information.
All investments involve risk, and the past performance of a security, industry, sector, market, financial product, trading strategy, backtest, or individual's trading does not guarantee future results or returns. Investors are fully responsible for any investment decisions they make. Such decisions should be based solely on an evaluation of their financial circumstances, investment objectives, risk tolerance, and liquidity needs.
My Scripts/Indicators/Ideas/Algos/Systems are only for educational purposes!

Market Structure CHoCH/BOS (Fractal) [LuxAlgo]The Market Structure CHoCH/BOS (Fractal) indicator is an experimental take on classical market structure, whereas fractal patterns are used for their construction instead of swing points.
Compared to utilizing swing points for highlighting market structure like our Smart Money Concepts indicator , fractal-based market structure can appear as more adaptive, however, it can also be more restrictive when it comes to returning swing points which can cause the indicator to miss reversals in some cases.
If enabled from within the settings, users can see support and resistance levels returned from the detected market structure with breakouts highlighted on the chart. Alongside this feature, an additional dashboard showing the structure to fractal structure percentage is also provided.
🔶 SETTINGS
Length: Length of the fractal patterns to detect.
🔹 Style
Bullish Structures: Show bullish structures.
Bearish Structures: Show bullish structures.
Support: Show support levels.
Resistance: Show resistance levels.
🔹 Dashboard
Show Dashboard: Show structure to fractal percentage dashboard on the chart.
Location: Location of the dashboard on the chart.
Size: Dashboard size.
🔶 USAGE
Market structure is commonly used to determine trend direction by using price positions relative to prior swing points. Using fractal patterns to determine market structure can allow users to obtain shorter, more frequent structure labels.
Market structure is commonly classified as follows:
Change of Character (CHoCH), also referred to as Market Structure Shift (MSS)
Break of Structure (BOS), also referred to as Market Structure Break (MSB)
Change of Characters indicate a shift in the market trend, confirming trend reversals. Break of Structures on the other hand occur once a trend is already determined, confirming new higher highs/lower lows.
Using higher length values allow users to detect longer-term fractals, thus highlighting longer-term market structures. The image above detects fractal patterns made of 7 candles, even if the increment is only of 2 bars this significantly reduces the amount of detected market structure labels.
The result obtained by utilizing fractals and higher settings can be a more dynamic view of market structure, however, as seen in the image above this can introduce very significant delay compared to utilizing pure swing points.
🔹 Support/Resistance
The indicator also returns support/resistance levels constructed from the market structure, these levels are obtained similarly to order blocks, finding the minimum on the interval of a bullish market structure and the maximum of a bearish market structure.
Price reaching a support/resistance level can be expected to bounce from it. Once a level is broken, the support/resistance level will no longer extend, and a circle will be displayed highlighting the break.
While utilizing this script for fractal-based market structure, these levels can be useful to ensure all swing points are still considered by the user with the possibility of the indicator missing reversals due to its calculation not being based on swing points themselves.
🔹 Dashboard
The dashboard reports the structure to fractal percentage, that is the amount of bullish/bearish market structures relative to the total amount of detected bullish/bearish fractal patterns.
This allows us to see how often a detected fractal pattern is used to display a market structure.
🔶 DETAILS
🔹 Fractals
In the context of technical analysis, Fractals refer to specific patterns that exhibit self-similarity at different scales or timeframes.
The most commonly known fractal pattern consists of a consecutive sequence of candles (more commonly 5), with the central candle being the lowest (in case of a bullish fractal) or highest (in case of a bearish fractal).
A bullish fractal has candles on the right side of the central candle with increasing lows, while candles on the left side have decreasing lows.
A bearish fractal has candles on the right side of the central candle with decreasing highs, while candles on the left side have increasing highs.
🔶 RELATED SCRIPTS
🔹 Smart Money Concepts
🔹 Market Structure Trailing Stop
🔹 ICT Concepts

Liquidity Candles with Prev Day High/Low and Midnight OpenAlright, let's talk about how to use this fancy indicator. But first, let me warn you, using indicators is like driving a car, you can't just press the gas pedal and hope for the best. You need to know what you're doing, or else you'll crash and burn faster than a soufflé in a microwave.
Now, let's get started. The first thing you need to do is understand what this indicator is telling you. Think of it like a signalman at a train station. He's waving flags and giving hand signals to tell you whether it's safe to proceed or if you need to stop and wait. This indicator works the same way.
It's going to give you signals based on price movements, telling you whether it's safe to buy or sell. But don't get too excited, my friend. You still need to use your brain and make smart decisions. Don't just blindly follow the signals, or else you'll end up like a sheep being led to the slaughter.
Now, let's talk about some of ICT's smart money trading concepts. First up, we have "liquidity grabs". This is when the big boys in the market create false breakouts to shake out the weak hands. They're like school bullies stealing lunch money from the little kids. But you can avoid being a victim by watching for signs of a liquidity grab, and using your brain to decide whether it's a real breakout or just a trap.
Next up, we have "stop runs". This is when the big players purposely trigger stop-loss orders to get a better entry or exit. It's like a game of chicken, but with your money on the line. To avoid being run over, keep an eye on your stop-loss orders, and don't be too predictable in your trading.
Finally, we have "market structure". This is like the blueprint of the market, showing you where the support and resistance levels are. It's like a treasure map to finding the best trades. But don't forget that market structure can change over time, so keep updating your map and stay ahead of the game.
So there you have it, my friend. A quick tutorial on using this indicator, with a side of ICT's smart money trading concepts. But remember, indicators are just tools, and you're the one driving the car. Use your brain, stay alert, and don't be a sheep. Happy trading!
Divergent Trades LLC:
Disclaimer: The information provided by the Divergent Trades LLC indicator is for educational and informational purposes only. It should not be considered financial advice or a recommendation to buy, sell, or trade any financial instrument. Divergent Trades LLC is not responsible for any losses incurred as a result of using this indicator. Trading in the financial markets carries a high level of risk and may not be suitable for all investors. Before making any investment decisions, please consult with a financial advisor and do your own due diligence. Past performance is not indicative of future results. By using the Divergent Trades LLC indicator, you acknowledge that you have read and understand this disclaimer and agree to its terms and conditions.

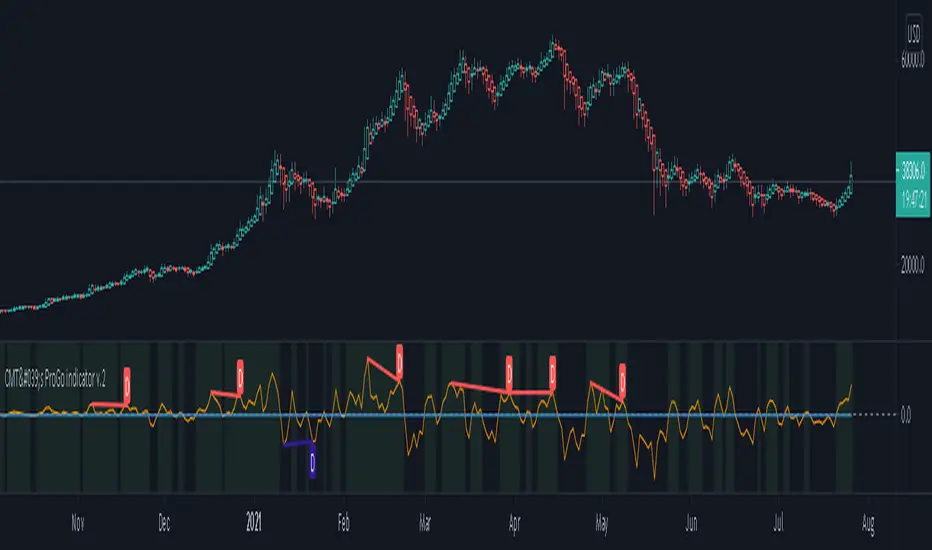
CMT's ProGo indicator v.2This was inspired by William's ProGo, which is an oscillator with a fast line based on today's open minus close compared to a slow line derived from yesterday's open minus close. These are tied to the 14 day SMA in both cases. William's hypothesis is that smart money makes its decisions based on what's happening now and dumb money makes their decisions slower. My hypothesis is that smart money reacts faster and in a more straightforward manner based on current price action while dumb money takes even longer than WIlliam's factored due to overthinking things. To reflect this, I've tied the pro line to the 1 SMA and the amateur line to the 21 SMA then changed the formula for the amateur line to open divided by close. That's a really cute story and all, but let's throw out all of the smart money/dumb money stuff and strap our boots to reality.
How to use:
1.) What we're looking at in the end is an examination of the relationship between price action and the 21 SMA. Since we're exploring rate of change and momentum, divergences should be relevant, right? And divergences are relevant in this indicator. These divergences are pretty good and tend to work in harmony with the trend, though can signal reversal points.
2.) This is not a real time oscillator. It involves three levels of derivation. Sometimes it'll provide leading signals and sometimes it'll show lagging signals because we're comparing the present against the past through a filter.
3.) I've noticed that this oscillator can be used to generate angled trend lines in some cases before they become evident through price action. This is interesting. What you'll do is slap some trend lines onto the oscillator, copy those then paste them onto the price action chart, copy them a few times to create a channel and see what's what. Horizontal support and resistance on the oscillator seems to translate into future price action S/R as well. THAT's interesting.
4.) On lower time frames, this indicator will do a pretty good job of letting you know whether you're in a bearish or bullish trend.
5.) Because of how the oscillator is formulated, it only recognizes Bitcoin as either bullish or ranging on higher time frames and will only ever register bearish on lower time frames. I don't think this will ever change, but if it does register BTC as bearish on higher time frames, I'd be real worried about Bitcoin.
6.) You'll notice that over time, volatility in the oscillator increases. Neat, huh? Yeah, it'll increase as market cap does. Take care and have fun with that.
v2.0 Improvements:
Divergences have been added.
VPA ANALYSIS VPA Analysis provide the indications for various conditions as per the Volume Spread Analysis concept. The various legends are provided below
LEGEND DETAILS
UT1 - Upthrust Bar: This will be widespread Bar on high Volume closing on the low. This normally happens after an up move. Here the smart money move the price to the High and then quickly brings to the Low trapping many retail trader who rushed into in order not to miss the bullish move. This is a bearish Signal
UT2 -Upthrust Bar Confirmation: A widespread Down Bar following a Upthrust Bar. This confirms the weakness of the Upthrust Bar. Expect the stock to move down
Confirms . This is a Bearish Signal
PUT - Pseudo Upthrust: An Upthrust Bar in bar action but the volume remains average. This still indicates weakness. Indicate Possible Bearishness
PUC -Pseudo Upthrust Confirmation: widespread Bar after a pseudo–Upthrust Bar confirms the weakness of the Pseudo Upthrust Bar
Confirms Bearishness
BC - Buying Climax: A very wide Spread bar on ultra-High Volume closing at the top. Such a Bar indicates the climatic move in an uptrend. This Bar traps many retailers as the uptrend ends and reverses quickly. Confirms Bearishness
TC - Trend Change: This Indicates a possible Trend Change in an uptrend. Indicates Weakness
SEC- Sell Condition: This bar indicates confluence of some bearish signals. Possible end of Uptrend and start of Downtrend soon. Bearish Signal
UT - Upthrust Condition: When multiple bearish signals occur, the legend is printed in two lines. The Legend “UT” indicates that an upthrust condition is present. Bearish Signal
ND - No demand in uptrend: This bar indicates that there is no demand. In an uptrend this indicates weakness. Bearish Signal
ND - No Demand: This bar indicates that there is no demand. This can occur in any part of the Trend. In all place other than in an uptrend this just indicates just weakness
ED - Effort to Move Down: Widespread Bar closing down on High volume or above average volume . The smart money is pushing the prices down. Bearish Signal
EDF - Effort to Move Down Failed: Widespread / above average spread Bar closing up on High volume or above average volume appearing after ‘Effort to move down” bar.
This indicates that the Effort to move the pries down has failed. Bullish signal
SV - Stopping Volume: A high volume medium to widespread Bar closing in the upper middle part in a down trend indicates that smart money is buying. This is an indication that the down trend is likely to end soon. Indicates strength
ST1 - Strength Returning 1: Strength seen returning after a down trend. High volume adds to strength. Indicates Strength
ST2 - Strength Returning 2: Strength seen returning after a down trend. High volume adds to strength.
BYC - Buy Condition: This bar indicates confluence of some bullish signals Possible end of downtrend and start of uptrend soon. Indicates Strength
EU - Effort to Move Up: Widespread Bar closing up on High volume or above average volume . The smart money is pushing the prices up. Bullish Signal
EUF - Effort to Move Up Failed: Widespread / above average spread Bar closing down on High volume or above average volume appearing after ‘Effort to move up” bar.
This indicates that the Effort to move the pries up has failed. Bearish Signal
LVT- Low Volume Test: A low volume bar dipping into previous supply area and closing in the upper part of the Bar. A successful test is a positive sign. Indicates Strength
ST(after a LVT ) - Strength after Successful Low Volume Test: An up Bar closing near High after a Test confirms strength. Bullish Signal
RUT - Reverse Upthrust Bar: This will be a widespread Bar on high Volume closing on the high is a Down Trend. Here the buyers have become active and move the prices from the low to High. The down Move is likely to end and up trend likely to start soon. indicates Strength
NS - No supply Bar: This bar indicates that there is no supply. This is a sign of strength especially in a down trend. Indicates strength
ST - Strength Returns: When multiple bullish signals occur, the legend is printed in two lines. The Legend “ST” indicates that an condition of strength other than the condition mentioned in the second line is present. Bullish Signals
BAR COLORS
Green- Bullish / Strength
Red - Bearish / weakness
Blue / White - Sentiment Changing from bullish to Bearish and Vice Versa

SMC Alpha Engine [PhenLabs]📊 SMC Alpha Engine
Version: PineScript™ v6
📌 Description
The SMC Alpha Engine is a comprehensive Smart Money Concepts indicator that automates institutional trading pattern recognition. Built for traders who understand that confluence is king, this indicator stacks multiple SMC elements together and scores them in real-time, allowing you to focus exclusively on high-probability setups.
Rather than manually tracking HTF bias, market structure, liquidity levels, order blocks, and fair value gaps separately, the SMC Alpha Engine consolidates everything into a unified scoring system. When enough factors align, you get a signal. When they don’t, you wait. This systematic approach removes emotion and subjectivity from SMC trading.
The indicator is designed around one core principle: only trade when the probabilities are stacked in your favor. By requiring multiple confluence factors before generating signals, it filters out the noise and keeps you focused on setups that institutional traders actually care about.
🚀 Points of Innovation
Automated confluence scoring system that evaluates 6 distinct SMC factors in real-time
HTF-to-LTF bias alignment ensuring trades flow with institutional direction
Intelligent liquidity sweep detection using wick-ratio analysis for confirmation
ATR-based FVG quality filtering that eliminates noise and shows only significant imbalances
Anti-spam signal logic preventing overtrading during volatile market conditions
Session-aware killzone integration timing entries with institutional activity windows
🔧 Core Components
HTF Bias Engine: Analyzes higher timeframe swing structure to establish directional bias using pivot high/low comparisons
Market Structure Module: Detects BOS (Break of Structure) and CHoCH (Change of Character) with real-time confirmation
Premium/Discount Calculator: Dynamically maps price zones relative to recent swing range equilibrium
Liquidity Tracker: Monitors swing points as liquidity targets and identifies sweep events with rejection confirmation
POI Detector: Identifies valid Order Blocks with displacement requirements and Fair Value Gaps with ATR filtering
Confluence Scorer: Aggregates all factors into bull/bear scores displayed on real-time dashboard
🔥 Key Features
Multi-timeframe analysis combining HTF directional bias with LTF precision entries
Customizable confluence threshold from 1 (low filter) to 5 (sniper mode)
Three killzone sessions: London (02:00-05:00), NY AM (08:30-11:00), NY PM (13:30-16:00)
Flexible mitigation options for OBs and FVGs: Wick, Close, 50%, or None
Visual structure labeling for BOS and CHoCH events on chart
Real-time info dashboard showing all current market conditions and scores
Built-in alert conditions for BOS, liquidity sweeps, and high-confluence signals
🎨 Visualization
Premium Zone: Red-tinted box above equilibrium indicating sell-side interest areas
Discount Zone: Green-tinted box below equilibrium indicating buy-side interest areas
Equilibrium Line: Dotted gray line marking the 50% level of current range
Order Blocks: Color-coded boxes (green for bullish, red for bearish) showing institutional candles
Fair Value Gaps: Teal boxes for bullish FVGs, maroon boxes for bearish FVGs
Killzone Backgrounds: Blue (London), Orange (NY AM), Purple (NY PM) session highlighting
Info Table: Top-right dashboard displaying HTF bias, LTF trend, zone, killzone status, and scores
📖 Usage Guidelines
HTF Settings
HTF Timeframe - Default: 60 - Controls higher timeframe for directional bias
HTF Swing Length - Default: 10, Range: 3+ - Determines pivot sensitivity for HTF trend
Market Structure Settings
LTF Swing Length - Default: 3, Range: 1-10 - Controls swing detection sensitivity
Show BOS/CHoCH - Default: Off - Toggles structure labels on chart
Show Strong/Weak Points - Default: Off - Displays swing point classifications
POI Settings
Show Valid Order Blocks - Default: Off - Displays OBs that caused displacement
Show Unmitigated FVGs - Default: On - Shows active fair value gaps
Filter FVG by ATR - Default: On - Only shows FVGs larger than 0.5x ATR
OB Mitigation Type - Options: Wick, Close, None - Determines when OBs are invalidated
FVG Mitigation Type - Options: Wick, Close, 50%, None - Determines when FVGs are filled
Confluence Settings
Minimum Score for Signal - Default: 4, Range: 1-5 - Required confluence level for entries
Show Entry Signals - Default: On - Toggles LONG/SHORT labels on chart
✅ Best Use Cases
Trend continuation trades during active killzone sessions with HTF alignment
Discount zone entries on bullish HTF bias with recent liquidity sweep below
Premium zone shorts on bearish HTF bias after liquidity grab above recent highs
Reversal identification following CHoCH with POI confluence in optimal zone
Filtering existing strategy signals by requiring minimum confluence score
⚠️ Limitations
HTF bias detection requires sufficient price history for accurate pivot identification
Liquidity sweep detection depends on wick-ratio settings and may miss some events
Order blocks require displacement confirmation which may exclude some valid zones
Confluence scoring is probabilistic and does not guarantee profitable outcomes
Killzone times are based on EST/EDT and require timezone adjustment for other regions
Signal spam prevention may delay valid signals by up to 10 bars after previous signal
💡 What Makes This Unique
Unified SMC Framework: Combines all major SMC concepts into one cohesive indicator rather than requiring multiple tools
Objective Scoring System: Removes subjectivity by quantifying confluence into measurable scores
Institutional Timing Integration: Built-in killzone awareness ensures signals align with high-volume sessions
Quality Filtering: ATR-based FVG filtering and displacement-required OBs eliminate low-quality setups
Anti-Overtrading Logic: Smart signal spacing prevents emotional trading during choppy conditions
🔬 How It Works
Step 1: HTF Bias Determination
Analyzes higher timeframe pivot highs and lows
Compares consecutive pivots to identify HH/HL (bullish) or LH/LL (bearish) sequences
Establishes directional filter that all signals must respect
Step 2: LTF Structure Mapping
Detects swing points on execution timeframe
Identifies BOS when price closes beyond confirmed swing level
Recognizes CHoCH when structure break occurs against current trend
Step 3: Confluence Calculation
Awards +1 for HTF bias alignment
Awards +1 for active killzone timing
Awards +1 for optimal zone positioning (discount for longs, premium for shorts)
Awards +1 for price at unmitigated POI
Awards +1 for recent liquidity sweep in trade direction
Awards +1 for recent supportive structure break
Step 4: Signal Generation
Compares total score against user-defined minimum threshold
Requires candle confirmation (bullish close for longs, bearish close for shorts)
Applies 10-bar spacing filter to prevent signal clustering
💡 Note:
This indicator is designed for traders already familiar with Smart Money Concepts. While it automates detection and scoring, understanding why each factor matters will significantly improve your ability to filter signals and manage trades effectively. Use the minimum confluence setting to match your risk tolerance, higher values mean fewer but higher-quality signals.

SMC + Dual UT Bot buy and sell AlertsMise a jour avec un EMA 20/50 et vwap
his script is a composite indicator for TradingView (Pine Script v5) that merges Smart Money Concepts (SMC) with a Dual-instance UT Bot. It has been styled with a high-contrast "Neon Cyberpunk" theme (Cyan/Pink) and is fully compliant with the CC BY-NC-SA 4.0 license.
Here is a breakdown of its two main components:
1. Smart Money Concepts (SMC)
This portion, originally by LuxAlgo, is designed to identify institutional price levels and structural market shifts. It provides a detailed map of market structure rather than simple entry/exit signals.
Market Structure (BOS & CHoCH):
BOS (Break of Structure): Marks trend continuation (e.g., breaking a higher high in an uptrend).
CHoCH (Change of Character): Marks potential trend reversals (e.g., the first time a higher low is broken in an uptrend).
Order Blocks (OB):
Highlights specific candles where institutional buying or selling likely occurred. These act as high-probability support/resistance zones.
Neon Blue/Cyan for Bullish OBs.
Neon Pink for Bearish OBs.
Fair Value Gaps (FVG):
Identifies imbalances (gaps) in price action where the market often returns to "fill" orders.
Neon Mint for Bullish FVGs.
Neon Red for Bearish FVGs.
Premium/Discount Zones: Automatically plots the range equilibrium (50% level) to help you buy in "Discount" (low) and sell in "Premium" (high) areas.
Liquidity (EQH/EQL): Automatically detects "Equal Highs" and "Equal Lows," which are magnets for price as they represent liquidity pools (stop losses).
2. Dual UT Bot Alerts
This portion provides the actual Entry Signals. It runs two separate instances of the "UT Bot" strategy simultaneously with different sensitivity settings to filter noise.
Instance 1 (Buy Only):
Settings: Key Value = 4, ATR Period = 10 (Faster, more sensitive).
Visual: Plots a Neon Cyan "Buy" label.
Function: Looks for bullish reversals earlier to catch the start of a move.
Instance 2 (Sell Only):
Settings: Key Value = 7, ATR Period = 20 (Slower, smoother).
Visual: Plots a Neon Pink "Sell" label.
Function: Uses a wider ATR band to avoid getting shaken out of shorts too early, focusing on major downtrends.
How to Use It
The strength of this script is confluence.
Wait for a Signal: Look for a UT Bot "Buy" or "Sell" tag.
Confirm with SMC: Check if the signal aligns with SMC concepts.
Example Buy: Did the UT Bot give a "Buy" signal while price was bouncing off a Bullish Order Block?
Example Buy: Did price just sweep Liquidity (EQL) before the Buy signal?
Example Sell: Is the "Sell" signal happening inside a Premium Zone or a Bearish Fair Value Gap?
avant-hier
Notes de version
1. "Pro" Badge Buy/Sell Labels
The standard text signals have been replaced with modern, professional Badge Labels that provide more information at a glance.
Visuals: Instead of simple text, the script now uses label.new to create high-visibility badges.
BUY: A Neon Cyan badge with a Rocket icon (🚀).
SELL: A Neon Pink badge with a Chart icon (📉).
Price Details: Each badge displays the exact Entry Price directly on the label.
Tooltips: If you hover your mouse over a Buy or Sell badge, a tooltip will appear showing the exact Take Profit (TP) and Stop Loss (SL) prices calculated for that trade.
2. Dynamic Take Profit (TP)
The script now automatically calculates a profit target for every trade the moment a signal is generated.
Calculation: It measures the distance between your Entry Price and the initial Stop Loss (the ATR Trailing Stop).
Risk:Reward: It multiplies that distance by your chosen Risk:Reward Ratio (default is 1.5) to project a TP target.
Visual Line: A Green Line is drawn on the chart at the TP level. It remains active until price hits it or the stop loss.
3. Active Trailing Stop Loss (SL)
The Stop Loss is no longer static; it is now "alive" and manages the trade for you.
Trailing Logic: If Use Trailing SL? is enabled (default), the SL line will automatically move up (for longs) or move down (for shorts) as the trend continues in your favor. It locks in profit by following the UT Bot's ATR trailing band.
Visual Line: A Red Line is drawn at the SL level. You can see it physically step up or down on the chart as the trend progresses.
4. Real-Time Trade Simulation
The script now simulates the lifecycle of a trade directly on the chart:
Active State: When a trade is live, the TP and SL lines extend to the right of the current candle (bar_index + 1), showing you exactly where your exit points are in real-time.
Closed State: Once the price hits either the Green TP line or the Red SL line, the script detects the "Exit." The lines stop extending and turn dotted, indicating that the trade is closed and waiting for the next signal.
Summary of New Settings
You will find a new group in the settings panel called "UT Bot: Trade Management":
TP Risk:Reward Ratio: Adjust this to change how far the Green TP line is placed (e.g., set to 2.0 for 2x return).
Use Trailing SL?: Uncheck this if you want the Red SL line to stay fixed at the initial entry risk level.
avant-hier
Notes de version
1. Live Strategy Performance Dashboard (Backtester)
Since this is an indicator, TradingView does not automatically calculate PnL (Profit and Loss). I have built a custom Simulation Engine inside the script that tracks every UT Bot signal as if you had taken the trade.
Location: Bottom Right of your chart.
Win Rate: Displays the percentage of trades that hit the Take Profit target versus the Stop Loss.
Trades (W/L): Shows the total number of signals generated, broken down by Wins and Losses.
Net Profit (R): Calculates your theoretical profit in "R-Multiples" (Risk Units).
Example: If you set your Risk:Reward to 2.0, every win adds +2R, and every loss subtracts -1R.
Dynamic Colors: The Win Rate and Profit cells turn Neon Cyan if positive (>50% or >0R) and Neon Pink if negative.
2. Multi-Timeframe Trend Dashboard
A new panel at the Top Right gives you an instant "Market Bias" reading so you don't have to scan the whole chart.
SMC Trend: Reads the Smart Money structure (Break of Structure/Change of Character) to determine if the high-level timeframe is BULLISH or BEARISH.
UT Bot Status: Displays the current active signal state:
BUY (Active): You are currently in a Long trade.
SELL (Active): You are currently in a Short trade.
NEUTRAL: No active signal or the last trade hit TP/SL.
3. Integrated Alert System
I have connected the visual lines to the alert system. You can now set a single alert on this indicator, and it will trigger for:
Entry Signals: "UT Long Entry" / "UT Short Entry"
Exits: "Take Profit Hit" / "Stop Loss Hit"
4. Consolidated Settings
To make the script easier to manage, I organized the settings into clear groups:
Dashboards: Toggle the visibility of the new panels or move the Performance Panel to a different corner.
UT Bot: Trade Management: Quickly adjust your Risk:Reward Ratio (e.g., change from 1.5 to 2.0) to see how it affects your Win Rate in real-time on the dashboard.
avant-hier
Notes de version
1. Multi-Timeframe (MTF) Trend Scanner
I have replaced the basic "Market Bias" panel with a comprehensive MTF Trend Dashboard located at the Top Right of your chart.
What it tracks: It simultaneously monitors the trend direction on 5 distinct timeframes:
15 Minute
1 Hour
4 Hour
Daily
Weekly
How it works: It runs a background calculation (using UT Bot settings Key=5, ATR=15) on these higher timeframes without you needing to switch charts.
Visuals:
BULLISH: Highlighted in Neon Cyan.
BEARISH: Highlighted in Neon Pink.
2. Strategic Confluence (How to use it)
This new dashboard transforms the script from a simple "signal generator" into a complete trading system by allowing you to filter trades based on the bigger picture.
The "All-Green" Rule: If you are scalping on a 5-minute chart and you get a BUY signal, check the dashboard. If the 1H, 4H, and Daily are all Neon Cyan (Bullish), that trade has a significantly higher probability of success.
Avoid Counter-Trend Trades: If your main chart says BUY, but the dashboard shows the 4H and Daily are Neon Pink (Bearish), you are trading against the major trend. You might want to skip that trade or reduce your risk size.
3. Summary of Dashboards
You now have two professional-grade panels on your screen:
Bottom Right (Performance): Shows the past results of the strategy on your current timeframe (Win Rate, Profit Factor).
Top Right (Trend): Shows the current state of the market across all timeframes.

FVG & OB [odnac]This indicator is a sophisticated tool designed for Smart Money Concepts (SMC) traders. It automates the detection of two critical institutional footprints: Order Blocks (OB) and Fair Value Gaps (FVG), with a focus on candle momentum and mitigation tracking.
Key Features
1. Advanced Momentum Filtering (3 Versions)
Unlike basic indicators, this script uses three different mathematical approaches to ensure the middle candle represents a "strong" move:
V1 (Body Focus): Compares the bodies of the surrounding candles to the middle candle.
V2 (Hybrid): Uses a mix of candle ranges and bodies to identify expansion.
V3 (Range Focus): The most aggressive filter; it ensures the total range of the middle candle dwarfs the surrounding candles.
2. Automatic Mitigation Tracking
The indicator doesn't just draw static boxes. It tracks price action in real-time:
Dynamic Extension: Boxes extend to the right automatically as long as price has not returned to "test" or "fill" the zone.
Smart Clean-up: Once the price touches the zone (Mitigation), the box stops extending or is removed. This keeps your chart clean and focused only on "fresh" (unmitigated) levels.
3. Smart Money Concept Integration
Order Blocks (White Boxes): Identifies where institutional buying or selling occurred before a strong move.
Fair Value Gaps (Yellow Boxes): Highlights price imbalances where the market moved too fast, leaving a gap that often acts as a magnet for future price action.
Technical Logic Breakdown
Detection Logic
The script looks at a 3-candle sequence:
Candle (The Origin): Defines the boundary of the OB or FVG.
Candle (The Expansion): Must be a "Strong Candle" based on your selected setting (V1, V2, or V3).
Candle (The Confirmation): Ensures that the "Tail Gap" condition is met (the wick of Candle 2 and Candle 0 do not touch).
Box Management
The script uses Pine Script Arrays to manage up to 500 boxes. It constantly loops through active boxes to check:
Time Limit: If a box exceeds the max_bars_extend limit, it is removed to save memory.
Price Touch: If low or high enters the box coordinates, the zone is considered "mitigated" and the extension stops.

Liquidity Trap Detector Pro [PyraTime]The Problem: Why You Get Stopped Out
90% of retail traders place their stop-losses at obvious swing highs and lows. Institutional algorithms ("Smart Money") are programmed to push price through these levels to trigger liquidity, fill their heavy orders, and then immediately reverse the market.
If you have ever had your stop hit right before the market moves exactly where you predicted—you were the victim of a Liquidity Trap.
The Solution: Visualizing the "Stop Hunt"
Liquidity Trap Detector Pro is not just a support/resistance indicator. It is a comprehensive Reversal Scoring Engine.
Unlike standard indicators that spam signals on every wick, this tool uses a proprietary 5-Star Scoring System to analyze the quality of the trap. It validates every signal using Wick Symmetry, RSI Divergence, and Volume Analysis to separate a true reversal from a trend continuation.
Key Features (USP)
- 5-Star Scoring Engine: Every signal is rated from 1 to 5 stars. Stop guessing if a signal is valid; let the algorithm check the confluence for you.
- Glassmorphism Visuals: Gone are the messy lines. We use modern, semi-transparent "Liquidity Zones" that keep your chart clean and professional.
- Smart Terminology: Automatically identifies Bull Traps (Buyers trapped at highs) and Bear Traps (Sellers trapped at lows).
- Heads-Up Display (HUD): A professional dashboard monitors the market state, active filters, and recent trap statistics in real-time.
- Strict Non-Repainting: (Technical Note) This script uses strict non-repainting logic. All Higher Timeframe (HTF) data is confirmed and closed before a signal is generated, ensuring historical accuracy.
---
Tutorial: How to Trade This Indicator
1. Understanding the Signals
We use correct institutional terminology to describe the market mechanics:
GREEN Signal (BEAR TRAP):
- What happened: Price swept a Swing Low, enticing sellers (Bears) to enter. The candle then reversed and closed back inside the range, trapping those sellers.
- The Trade: This is a Bullish Reversal setup (Long).
RED Signal (BULL TRAP):
- What happened: Price swept a Swing High, enticing buyers (Bulls) to breakout. The candle reversed and closed lower, trapping the buyers.
- The Trade: This is a Bearish Reversal setup (Short).
2. The 5-Star Scoring System
Not all traps are created equal. The stars tell you how much "Confluence" exists:
- 1 Star: A basic structure sweep. Risky.
- 3 Stars: A solid setup backed by either Volume or Divergence.
- 5 Stars: The "Perfect" Trap. Structure Sweep + RSI Divergence + Volume Spike + Wick Symmetry. High Probability.
3. The Strategy
- Wait for the Zone: Watch price approach a coloured Liquidity Zone.
- Observe the Reaction: Do not trade blindly. Wait for the candle to close.
- Check the Stars: Look for at least 3 Stars before considering an entry.
- Confirm with HUD: Glance at the Dashboard to ensure the "RSI Filter" and "Vol Filter" agree with your analysis.
---
Settings Guide
Structure Settings:
- Pivot Lookback: Adjusts how sensitive the zones are (Default: 10/5).
- HTF Confirmation: Optional filter to only show traps that align with Higher Timeframe structure (e.g., 1H or 4H).
Quality Filters:
- RSI Divergence: Requires momentum to disagree with price (classic reversal sign).
- Volume Spike: Requires volume to be higher than average (Smart Money footprint).
Visuals:
- Clean Mode: A presenter-favorite feature. Hides all historical zones and leaves only the active setup—perfect for taking screenshots or sharing analysis.
Disclaimer
This tool is designed to assist with technical analysis and identifying potential areas of interest. It does not guarantee profits. Trading involves significant risk; always use proper risk management.

Quantum Flow [JOAT]Quantum Flow Nexus - Advanced Multi-Dimensional Flow Analysis
Overview
Quantum Flow Nexus is an open-source overlay indicator that combines custom EMA-based flow calculations with order flow analysis, multi-timeframe correlation, and liquidity zone detection. It provides traders with a structured framework for analyzing market momentum and identifying potential entry points based on multiple confirming factors.
What This Indicator Does
The indicator calculates several analytical components:
Quantum Flow Oscillator - A custom oscillator built from multiple EMA layers at different depths
Flow Momentum - Rate of change of the flow oscillator
Order Flow Delta - Buy vs sell volume pressure estimation
Smart Money Index - Volume-weighted directional bias metric
Multi-Timeframe Entanglement - Price correlation across 15m and 60m timeframes
Liquidity Zones - Historical swing high/low levels with volume significance
Wave Function State - Momentum-based decisiveness detection
How It Works
The core quantum oscillator uses a custom EMA calculation with depth layering:
quantumOscillator(series float src, simple int len, simple int depth) =>
float osc = 0.0
for i = 1 to depth
int fastLen = len / i
int slowLen = len * i
float emaFast = quantumEMA(src, fastLen)
float emaSlow = quantumEMA(src, slowLen)
osc += (emaFast - emaSlow) / depth
osc
This creates a multi-layered view of momentum by comparing EMAs at progressively different speeds.
Signal Generation
Basic signals occur when:
Bullish: Flow crosses above lower band + positive momentum + positive order flow delta
Bearish: Flow crosses below upper band + negative momentum + negative order flow delta
Strong signals require additional confirmation:
Smart Money Index above/below threshold (50/-50)
Entanglement score above 50%
Wave function in collapsed state (decisive momentum)
Confluence Score Calculation
The indicator combines multiple factors into a single confluence percentage:
float confluenceScore = (flowStrength * 20 + entanglementScore * 0.3 + math.abs(orderFlowDelta) * 0.5) / 3
Dashboard Panel (Top-Right)
Flow Strength - Distance from center line normalized by standard deviation
Momentum - Current rate of change of flow
Trend - BULLISH/BEARISH/NEUTRAL based on flow vs EMA
Confluence Score - Combined factor percentage
Order Flow Delta - Buy/sell pressure percentage
Entanglement - Multi-timeframe correlation score
Wave State - COLLAPSED or SUPERPOSITION
Signal - Current actionable status
Visual Elements
Flow Lines - Center flow line with upper/lower bands
Quantum Zones - Filled areas between bands showing bullish/bearish zones
3D Quantum Field - Five oscillating layers creating depth visualization
Order Flow Blocks - Boxes highlighting significant order flow imbalances
Liquidity Heatmap - Dashed lines at significant historical levels
Signal Markers - Triangles for basic signals, labels for strong signals
Input Parameters
Flow Period (default: 21) - Base period for flow calculations
Quantum Depth (default: 3) - Number of EMA layers
Sensitivity (default: 1.5) - Band width multiplier
Liquidity Max Levels (default: 8) - Maximum liquidity zones displayed
Liquidity Min Strength Ratio (default: 0.10) - Minimum volume significance
Suggested Use Cases
Identify momentum direction using flow oscillator position
Confirm entries with order flow and smart money readings
Use liquidity zones as potential support/resistance areas
Wait for strong signals with multiple factor confirmation
Timeframe Recommendations
Effective on 15m to Daily charts. Lower timeframes may produce more signals with higher noise levels.
Limitations
Order flow is estimated from candle structure, not actual order book data
Multi-timeframe requests add processing time
Liquidity zones are based on historical pivots and may not reflect current market structure
Open-Source and Disclaimer
This script is published as open-source under the Mozilla Public License 2.0 for educational purposes. It does not constitute financial advice. Past performance does not guarantee future results. Always use proper risk management.
- Made with passion by officialjackofalltrades
